Nifty 50 vs S&P 500, Nikkei, FTSE: Truth Beyond Comparison?
- Posted By Amritesh
- On July 19th, 2026
- Comments: no responses
Since 2019, the S&P 500 has nearly tripled and the Nasdaq has surged even harder. Japan is having its best run in decades and Brazil just posted its best year since 2016. The Nifty 50, meanwhile, gained a comparatively modest ~44% over the last three years. Comparing Nifty 50 vs S&P 500, Nikkei, FTSE and Ibovespa raises an obvious question: is India actually falling behind the world — or is it stuck in the middle of a pack where a few markets are having an unusually good run?
1. The Pre-COVID Baseline: Where Everyone Stood in 2019
At the end of 2019, global equity markets were on comparable footing. The S&P 500 closed the year up roughly 29% (its best year since 2013), the Nasdaq 100 gained around 39%, and the Nifty 50 delivered a more modest but respectable 12% — already signalling that India was the laggard even before COVID hit. This is an important starting point, because much of the “India has stagnated” narrative implicitly compares India’s post-2023 slowdown to America’s post-2023 boom, without acknowledging that the US market was already compounding faster heading into the pandemic.
2. The COVID Crash and the Everything-Rally (2020–2021)
The pandemic crash was brutal and brief for both markets. The Nifty 50 fell nearly 38% peak-to-trough in March 2020 before closing the year down about 8%. The S&P 500 and Nasdaq, cushioned by aggressive Fed stimulus and a tech-heavy composition that thrived in a lockdown economy, ended 2020 up roughly 16% and 49% respectively.
2021 was the real divergence point in investor psychology: India’s retail investing boom (driven by discount brokers, UPI-linked trading accounts, and pandemic savings) pushed the Nifty 50 up about 24%, while the Nasdaq climbed another 27% and the S&P 500 gained close to 27%. Both markets were euphoric — just at different scales.
3. The Great Divergence: 2022–2025
This is where the comparison people are actually making begins. Here is how the three benchmark indices performed year-by-year, starting with 2022 — the global rate-hike crash year — for context on what came before the recovery:
| Year | S&P 500 | Nasdaq 100 | Nifty 50 |
| 2022 | -19.4% | -32.6% | +4.3% |
| 2023 | +24.2% | +56.4% | +20.0% |
| 2024 | +23.3% | +25.7% | +8.8% |
| 2025 | +16.4% | +19.5% | +10.5% |
| 3-Yr Cumulative (2023–25) | ~+78% | ~+135% | ~+44% |
| 4-Yr Cumulative (2022–25) | ~+44% | ~+58% | ~+51% |
(Figures are calendar-year index returns compiled from NSE Indices, S&P Dow Jones Indices, and Nasdaq-100/QQQ data. S&P 500 and Nifty 50 figures are price returns; Nasdaq 100 figures are QQQ ETF total returns, which include a small reinvested-dividend effect. On a dividends-reinvested total-return basis, the S&P 500’s own three-year (2023–25) return was higher, at approximately 88% — about 23% annualised — per S&P Dow Jones Indices’ official year-end commentary. Use these as directional, not exact-to-the-decimal.)
Adding 2022 back in changes the story in an important way. Over the last three years (2023–25), the US clearly outran India. But over the last four years (2022–25) — which includes the year the Fed’s rate-hike cycle hammered growth stocks — the Nifty’s ~51% cumulative return is actually ahead of the S&P 500’s ~44%, and not far behind the Nasdaq’s ~58%. That’s because India barely dipped in 2022 (+4.3%) while the S&P 500 fell 19.4% and the Nasdaq 100 fell 32.6%.
In other words, the “India is stagnant” narrative depends heavily on which year you start counting from: start in 2023 (right after the US snapped back from its worst year in over a decade) and India looks like the laggard; start in 2022 (before that snapback) and India looks like one of the steadier performers in the group. Both framings use real data — the difference is entirely in the choice of starting line.
The Nifty’s 3-year (2023–25) cumulative return isn’t technically “stagnant” either way — 44% over three years is roughly 13% annualised, in line with its own 20-year historical average of 12–14%. What has changed is the comparison set: on a total-return basis, the S&P 500 has compounded at just over 23% annualised for three straight years, something only a handful of 3-year windows have matched since 1871. Nifty didn’t slow down by its own standards; the US accelerated to a historically rare pace, then decelerated after coming from an unusually low base. That reframes the question from “why is India stagnant” to “why has India failed to keep pace with an outlier US rally since the 2022 low.”
It’s also worth noting that headline Nifty 50 numbers flatter the real investor experience. Mid-cap and small-cap indices — where a large share of retail SIP and direct-equity money sits — fell 15–25% from their late-2024 peaks during the 2025 correction, even while the Nifty 50 itself stayed roughly flat to positive. For the average Indian retail investor holding a diversified portfolio, 2024–2025 genuinely felt stagnant or worse, even if the headline benchmark tells a gentler story.
4. Zooming Out: How the UK, Japan, China and Brazil Fared
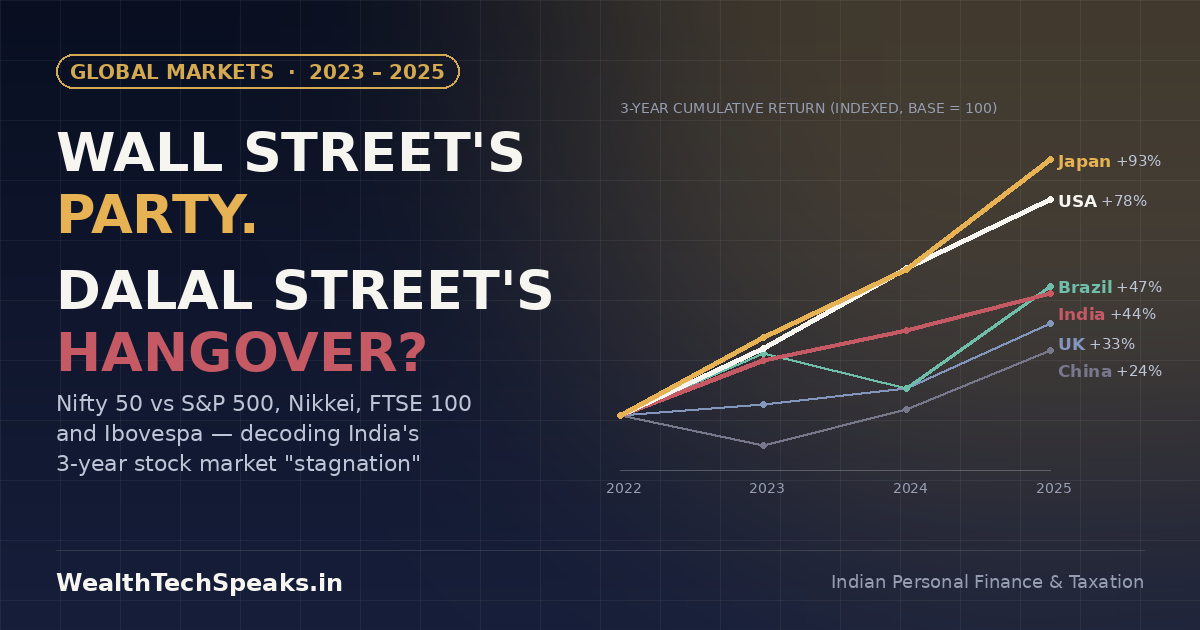
The India-vs-US framing is the one everyone reaches for, but it’s actually a bit misleading, because the US and Japan had the strongest runs of any major market these last three years. Widen the lens to the UK, China and Brazil too — and add back 2022, the year the global rate-hike cycle hit markets hardest — and a more accurate, more interesting picture appears: India isn’t at the bottom of the global pack, and where it ranks depends on which starting year you pick.
| Market (Index) | 2022 | 2023 | 2024 | 2025 | 3-Yr Cum. (’23–25) | 4-Yr Cum. (’22–25) |
| USA (S&P 500) | -19.4% | +24.2% | +23.3% | +16.4% | ~+78% | ~+44% |
| Japan (Nikkei 225) | -9.4% | +28.2% | +19.2% | +26.2% | ~+93% | ~+75% |
| Brazil (Ibovespa) | +4.7% | +22.3% | -10.4% | +34.0% | ~+47% | ~+54% |
| India (Nifty 50) | +4.3% | +20.0% | +8.8% | +10.5% | ~+44% | ~+51% |
| UK (FTSE 100) | +0.9% | +3.8% | +5.8% | +21.5% | ~+33% | ~+35% |
| China (CSI 300) | -21.6% | -11.4% | +14.7% | +17.7% | ~+20% | ~+6% |
(Rows are ordered by 3-year, 2023–25, cumulative return, highest to lowest. Figures are calendar-year local-currency price returns from index providers and financial press — NSE Indices, Nikkei Inc., S&P Dow Jones Indices, LSEG/FTSE Russell, CSI (official CSI 300 factsheet for China), and B3 — except Ibovespa, which is a total-return index by design (dividends are built into the index methodology, not added separately). In dollar terms the ranking would shift again — the FTSE 100 and Ibovespa gains are flattered by GBP and BRL moves against a softer dollar, while a weaker rupee has modestly dented India’s dollar returns too.)
Ranked by 3-year (2023–25) cumulative return, the order is: Japan (~+93%), USA (~+78%), Brazil (~+47%), India (~+44%), UK (~+33%), China (~+20%). But ranked by 4-year (2022–25) cumulative return — which brings the rate-hike crash year back into the picture — the order changes to: Japan (~+75%), Nasdaq (~+58%), Brazil (~+54%), India (~+51%), USA (~+44%), UK (~+35%), China (~+6%). India actually moves ahead of the S&P 500 on this longer view, purely because it barely fell in 2022 while the US and Nasdaq fell hard. A few things jump out:
- Which starting year you pick matters enormously. Starting the clock in 2023 makes India look like it’s lagging the US; starting in 2022 makes India look like it’s ahead of the US. Neither framing is wrong — they’re just answering different questions (“how did India do during the recent global boom” vs. “how did India do through a full rate-hike-and-recovery cycle”). Any comparison that only shows one of these windows is, whether deliberately or not, choosing its conclusion by choosing its start date.
- India and the UK are the only two markets in this table with no negative year at all across the full 2022–2025 stretch. The US, Japan, and China all had a down year (2022 for the first two, 2022 and 2023 for China); Brazil had one too (2024). Steadiness, not speed, has been India’s and the UK’s defining trait across this longer window.
- China is the clearest case of a market that still hasn’t dug itself out: even with back-to-back positive years in 2024 and 2025, its 4-year cumulative return is barely positive (~+6%), because the 2022–23 crash (a combined ~-30%) was so severe. It’s a reminder that a market can have two good years in a row and still be nowhere near recovered.
- Japan’s rally isn’t AI hype from a standing start either — it’s a decade-long corporate governance overhaul (the Tokyo Stock Exchange pushed companies to unlock cash hoards and improve capital efficiency) combined with a persistently weak yen that flatters exporter earnings and a historic exit from deflation. It’s arguably the most “fundamentals-driven” rally on this list, and the only one that looks strong on both the 3-year and 4-year view.
- The UK’s 2025 breakout came from an unusual place: mining, defence and banking stocks (not tech) rallying on commodity strength, defence spending, and rate cuts, off a cheap starting valuation. The FTSE 100 had genuinely lagged for years before this — so its 2025 “catch-up” is closer to the pattern people wrongly assume India is stuck in.
5. Why Did India Lag? Five Forces Behind the Slowdown
a) The Great FII Exodus
Foreign Institutional Investors turned aggressive net sellers of Indian equities from October 2024 onward. By the end of 2025, FIIs had pulled out roughly ₹1.6 lakh crore (about $18 billion) — the largest annual outflow on record. This selling directly suppressed index returns even as Domestic Institutional Investors (mutual funds, insurers, EPFO, banks) absorbed the supply with a record ₹7 lakh crore-plus of buying — proof that the “stagnation” was as much a foreign-money story as a fundamentals story.
b) Stretched Valuations Walking Into the Slowdown
Going into the correction, the Nifty was trading at a price-to-earnings multiple close to 21–22x against a 5–10 year historical average nearer 23–24x on paper, but relative to slowing earnings growth, that still looked expensive to global allocators — especially compared to China, which was trading closer to its own historical average and became the preferred “cheap reopening” trade after stimulus measures and AI-linked optimism (the DeepSeek moment) pulled emerging-market capital toward Chinese equities.
c) An Earnings Growth Air-Pocket
Corporate India’s earnings growth genuinely cooled — a mid-single-digit revenue growth pace in FY25 compared to double-digit growth investors had priced in through 2023. GDP growth itself decelerated from roughly 8.6% in Q3 FY24 to about 6.2% in Q3 FY25. Markets rarely tolerate slowing growth and rich valuations at the same time — one or the other has to give, and in India’s case, valuations gave way.
d) A Strong Dollar and a Weak Rupee
Trump-era tariff policy and a resurgent US dollar made emerging-market assets, India included, relatively less attractive on a currency-adjusted basis. The rupee slid toward the 90-per-dollar mark during 2025, which erodes the dollar-return that foreign investors actually care about — even when the rupee-denominated index looks flat, the dollar-denominated return can look considerably worse.
e) Global Capital Chasing a Narrower AI Trade
A large share of the US market’s 2023–2025 gains has been concentrated in a handful of AI-linked mega-caps — the so-called Magnificent Seven contributed more than half of the S&P 500’s returns in 2024 alone. That kind of narrow, thematic mega-cap rally is structurally different from a broad-based emerging-market re-rating, and it pulled global capital toward US tech at the expense of “under-owned” markets like India.
6. So, Is India’s Stagnation Justified?
Partially — and that nuance matters more than a simple yes or no.
- Justified: Valuations did need to correct after 2023’s exuberance, earnings growth did genuinely slow, and global capital did have a legitimate, higher-momentum alternative in US AI stocks and Chinese reopening plays.
- Not fully justified: India’s underlying macro story — a 6%+ GDP growth economy, formalising and increasingly digital, with a structurally growing domestic SIP base — did not change nearly as much as the price action suggests. Much of the FII selling was a global positioning and currency story, not a verdict on India’s long-term earnings power.
- The real signal to watch: Domestic Institutional flows crossing ₹7 lakh crore in a single year is arguably the more important structural story than the FII exodus. India is increasingly financing its own market — retail SIP inflows have stayed resilient through the correction, unlike previous cycles where retail money fled at the first sign of a drawdown.
History also offers a quiet reassurance here: no rolling 10-year SIP window in Nifty 50 history has ever delivered a negative return, including windows that started right before the 2008 crash. A 2–3 year period of underperformance relative to an unusually hot US market is not, by itself, evidence of a broken growth story — it is closer to a valuation reset after a period of getting ahead of itself.
7. Supplementary Update: What Happened in H1 2026
Everything above runs through full calendar year 2025. Since this is a live and fast-moving story, here’s how the first half of 2026 (January–June) has actually played out — and it adds a sharper, more urgent edge to the whole picture rather than resolving it.
| Market (Index) | H1 2026 Return | Direction vs. 2025 |
| Japan (Nikkei 225) | ~+39% | Accelerated |
| Nasdaq 100 | ~+19% | Similar pace |
| USA (S&P 500) | +9.6% (+10.2% total return) | Slower, still positive |
| Brazil (Ibovespa) | +6.8% | Much slower |
| UK (FTSE 100) | ~+6.5% | Slower |
| China (CSI 300) | ~flat (roughly 0 to +2%) | Much slower |
| India (Nifty 50) | -8.4% | Reversed to negative |
(H1 2026 figures are local-currency price returns for January–June 2026, compiled from RBC Wealth Management/FactSet, S&P Dow Jones commentary, Nikkei/press reporting, Upstox’s H1 2026 market review for NSE data, TradeMap/InfoMoney for B3 data, and index-level data for the FTSE 100 and CSI 300, where a single clean official H1 figure wasn’t available and a range is given instead. Ranked highest to lowest: Japan, Nasdaq, USA, Brazil, UK, China, India.)
Two things stand out. First, Nifty 50 was the single worst-performing major index in this table in H1 2026, and the only one to turn negative — down 8.4% year-to-date by the end of June, driven by a Middle East oil shock (Brent crude spiked toward $150 amid the Strait of Hormuz crisis), renewed FII selling (₹77,901 crore net sold in H1 2026 alone, already 2.5 times the pace of H1 2025), and a rupee that slid to around ₹95–96/USD.
Second, India’s largecap underperformance has now compounded with a second, separate problem: it mostly missed the 2026 AI-hardware rally that sent Japan, South Korea, and Taiwan — all heavy in chip and semiconductor stocks — up as much as 100% in the same six months. Indian largecaps have negligible exposure to the AI supply chain, so the very rally that pulled Japan even further ahead left India on the sidelines entirely.
This doesn’t overturn the core argument above — India’s underlying growth story and record domestic SIP inflows are still intact, and Nifty’s midcap and smallcap indices actually did far better in H1 2026 (smallcaps and microcaps were the standout gainers domestically, with the Nifty Microcap 250 up over 11%). But it does mean the gap between India and the rest of the world’s leading markets, which this article’s 2023–2025 data shows as a middling three-year story, has widened noticeably in just the first six months of 2026 — largely for reasons (a geopolitical oil shock, a currency slide, and non-participation in the AI-hardware trade) that are distinct from, and additional to, the FII/valuation/earnings story covered above.
8. The Takeaway for Indian Investors
The uncomfortable truth is that several things are true at once: the US has had one of its best three-year runs in over a century, Japan is in the middle of a genuine structural re-rating that has only accelerated into 2026, the UK and Brazil are catching up from years of being cheap and unloved, China is still digging out of its 2022–23 crash despite two good years since — and India’s market has gone through a real, earnings-and-flow-driven correction that is not simply a comparison illusion, one that has deepened further in the first half of 2026. Conflating all of this into a single
“India is stagnant” headline misses the more useful question: is India’s slowdown a structural derating, or a cyclical air-pocket inside a still-intact long-term growth story, sitting in a world where almost every major market happened to have a stronger stretch than usual at the same time?
The data — resilient domestic flows, GDP growth still well above global averages, and valuations now closer to historical norms — leans toward the latter, even after a rough H1 2026. But investors chasing the S&P 500’s or Nikkei’s recent numbers should remember that back-to-back-to-back double-digit years are the exception, not the rule, in any market’s long history. Comparing India’s normal to the world’s collective outlier stretch was always going to make India look worse than it is — the more useful exercise is watching India’s own earnings trajectory and FII/DII flow data from here, not chasing whichever index had the best headline last year.
Wealthtech Speaks or any of its authors are not responsible for any errors or omissions, accuracy, completeness, timeliness or for the results obtained from the use of this information. This article is for informational purpose only. Readers are advised to research further to have detailed knowledge on the topic. It is very important to do your own analysis and consult your Financial Advisor before arriving at any conclusion.
Categories
- All About Mutual Funds (20)
- Annual Budget (14)
- Banner (6)
- Bonus Act (1)
- Economic Trends (38)
- Economy (52)
- Employee Deposit Linked Insurance Scheme (EDLI) (1)
- Employees’ Benefits (37)
- Employees’ Pension Scheme (EPS) (11)
- Employees’ Provident Fund (EPF) (13)
- Employees’ State Insurance (ESI) (4)
- Equity Linked Savings Scheme (ELSS) (12)
- Gadgets Review (70)
- Gratuity Act (4)
- Health Insurance (10)
- Home Loans (5)
- HR Talks (6)
- Human Resource (18)
- Income Tax (70)
- Indirect Tax (1)
- Insurance (28)
- Investment Plans (55)
- Investments (74)
- Life Insurance (22)
- Loans (6)
- Mutual Funds (30)
- Other HR Laws (7)
- Personal Loans (4)
- Portfolio Management (14)
- Portfolio Management (7)
- Professional Tax (9)
- Retirement Benefits (14)
- Retirement Plans (22)
- SidebarAd (1)
- Statutory Benefits (19)
- Systematic Investment Plan (SIP) (7)
- Tax Planning (41)
- Taxation (78)
- Tech News (22)
- Technology (81)
- Wages Act (3)
- Wealth Speaks...!!! (68)